Quality Control
Sequencing Data
Quality is assessed before any preprocessing. The most important graph is the Quality Control Status Checks.
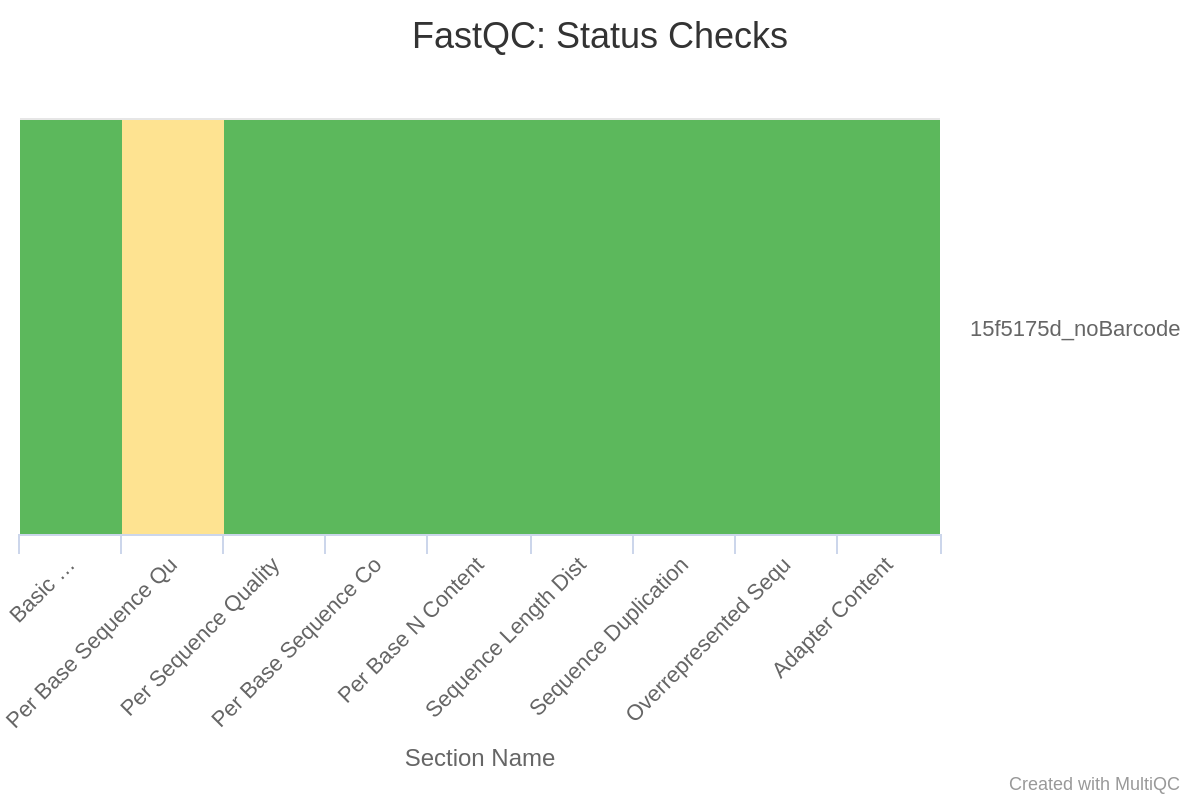
As with a stop light, green boxes reflects high quality data, yellow reflects a warning, and red reflects concern. Thresholds for this graph are custom tailored to your sequencing platform and experimental design. For example, nanopore sequences will flag as a warning if the average Per Sequence Quality (measured in Phred score) is below Q8, whereas Illumina sequences will flag if below Q20.
For a full description of graph content, please see the FastQC manual.
Assemblies
Basic Statistics
Basic assembly statistics, such as N50 and total length, are calculated with QUAST. We refer the reader to the QUAST interpretation guide for details on assembly plots and statistics in the BugSeq per-sample reports.
Bin Completeness
Bin completeness is assessed with BUSCO. We refer the reader to the BUSCO interpretation guide for details on the BUSCO plots contained in the BugSeq per-sample reports.